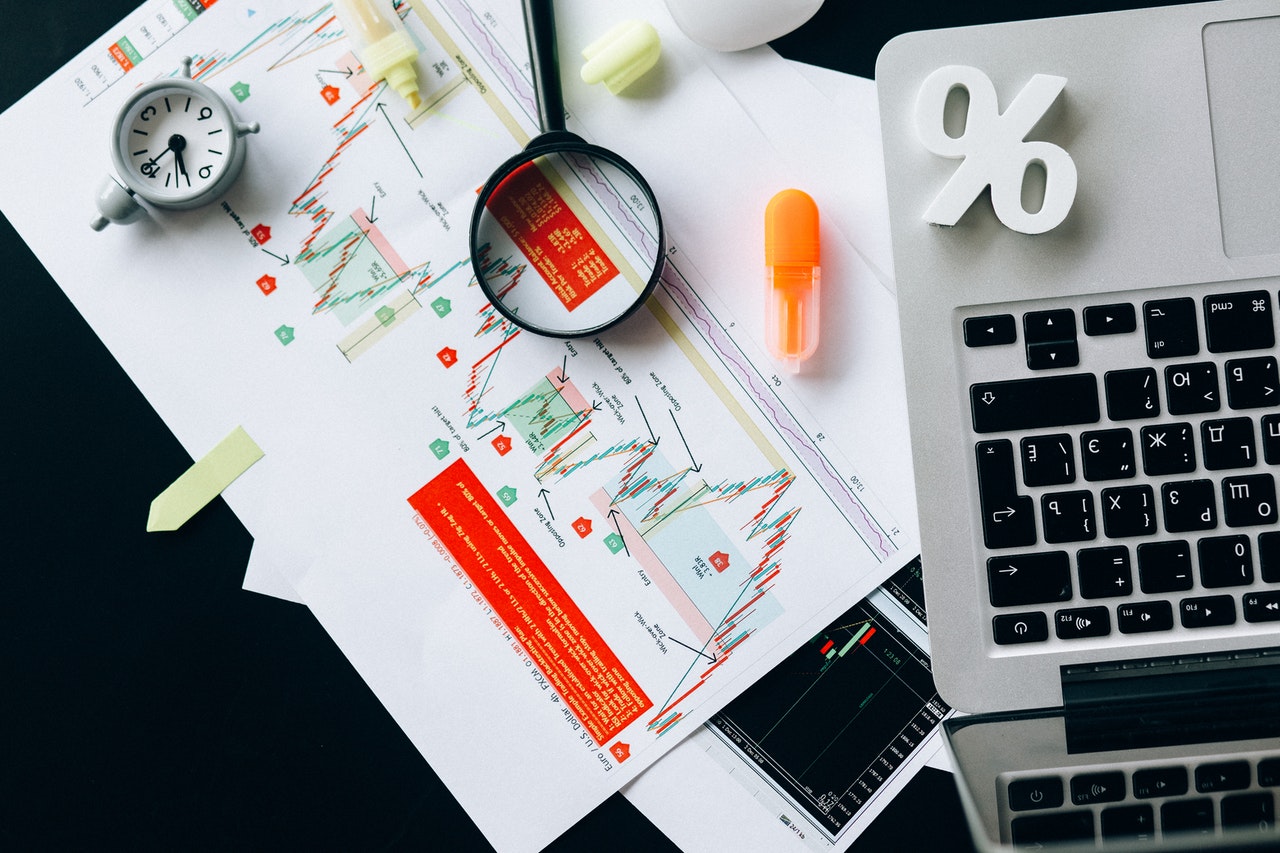
After opening a chart on a cryptocurrency exchange such as CEX.IO, a lot of people ask themselves the same question — where will the cryptocurrency price go next, and is it worth it to buy or sell right now. But sometimes it is not enough just to look at the current price to answer these questions, so traders use various methods of analysis. One of them is technical analysis.
There are three golden rules of technical analysis — the market discounts everything, prices move in trends, and history repeats itself.
The first rule says that markets are predominantly efficient, so any changes in market sentiment will be rapidly included in the asset price. The second rule indicates that price movement is not random. The movement has a certain momentum, and the market can both push and resist this movement. The third rule reminds us that people generally act the same way in similar situations. That is, the future price movement can be predicted based on close market events in the past.
But technical analysis is not limited to just these basic rules. Here are a few more little-known rules traders should also keep in mind when applying technical analysis.
Keep it simple
In its most basic form, the technical analysis includes price and volume data. But technical analysis is mostly known for a huge variety of indicators and formations. They are used to identify trends, potential price movement and reversal, searching for entry points, and evaluating risk parameters. Indicators and oscillators have different purposes, while patterns can either consist of just one candle or have a duration of several months.
Due to such an abundance of analysis tools, at first glance, the technical analysis seems to be some kind of quantum physics for newcomers.
All this is aggravated by the fact that many investors try to analyze the market using as many indicators as possible without understanding whether they are relevant in a given situation. Therefore, before setting up trading tools, it is worth considering whether 10-15 indicators are really more useful and accurate than two or three, or they lead to analysis paralysis.
At the initial stages, newcomers to trading cryptocurrencies can start with three main indicators that have already successfully established themselves in the crypto market — moving averages, Bollinger Bands, and Relative Strength Indicator (RSI). These indicators can already be effectively used to build a trading plan.
The indicators will help you find support and resistance levels that can be used for both finding entry and exit points. Traders may also get acquainted with the main chart figures in order to understand the conditions for their formation and confirmation.
As you become more experienced, you can double-check your analysis with additional elements and trading tools such as Fibonacci grids, or use advanced trading techniques such as squeeze trades with Bollinger Bands. Including volume changes in analysis can help you understand how strong a price movement is, and how it develops over time.
Patterns are self-replicating
One of the reasons why technical analysis works is a collective belief in its effectiveness. For a certain pattern to perform properly, a significant number of participants must believe in its formation and trade according to this pattern, which confirms it.
In the crypto market, this can be tricky. Technical analysis is often criticized because the crypto market is dominated by retail investors and they rarely focus on price patterns. Also, the crypto market is quite emotional and volatile, meaning everything can change in a moment, thereby potentially reducing the relevance time of the analysis.
So if you see a pattern on the chart, it does not necessarily mean that the broader market sees it as well. In this regard, monitoring general market sentiment and expectations can be very useful.
But even during pattern-based trading, many beginners make several mistakes. For instance, some believe that the breakout of an important level or line is always a confirmation of the pattern. But this is not the case because sometimes the price needs to cover a certain path after the breakout for confirmation.
The reason is that many traders, observing a certain pattern, can act counter-trend and place protection orders above or below the resistance or support level.
If there are a lot of them or the breakout was at low volume, then a false breakout or false confirmation of the pattern may occur and the price may return to the previous range.
The success of future analysis relies on the past analysis discovering.
Surfing the web, you can find tons of crypto technical analyses every day. But it is much less common to see a post after a technical analysis has been made, describing how much it was justified by the further price movement. A lot of people analyze for the sake of analysis and do not put it into action, diminishing its value.
Whatever you decide to do with your technical analysis — follow or ignore — many experts recommend writing down decisions and their results. This will allow you to understand over time how correct your approach was, and whether you did not take into account something. If the price moved the other way than according to your analysis, then applying various indicators to past results can be a useful exercise. This may help understand what indicator can be relevant in the current situation and maybe give a hint when similar events occur.
Another important element is understanding what the market conditions were when making the analysis. A volatile market may require looking at technical indicators a little differently than during a trending or range-bound market. Volatility can force traders to focus on extremes to look for reversals and changes in market behavior. In trending markets, traders usually apply protection orders as the market moves with the trend. During a range-bound market, traders generally look for potential breakouts up or down from the range, carefully monitoring volumes for confirmation.
Each market can become trending, range-bound, or volatile, and tracking past performance in different markets will help develop your own strategy for certain market conditions.
This article was written by Julia Beyers
About the Author:
Acquiring a wealth of experience in writing articles on trends and prospects for the development of the game industry in the world I’ve found myself as a Freelance Journalist. I am writing now about blockchain and cryptocurrencies trends, sometimes covering the importance of bitcoin for various other industries.
Featured Image Credits: Photo by Anna Nekrashevich from Pexels